
Blockstudy subscription
- Monthly
- Set at launch
- Annual
- Set at launch
- 30 studies a month
- Screenshot or symbol
- Sources behind each observation
- Indicators calculated from price data
- Bullish and bearish scenarios
- Clear labels for what's uncertain
For stock and crypto charts
Upload a stock or crypto chart, or choose a symbol. Get key levels, bullish and bearish scenarios, and the evidence behind each observation—checked against historical prices, with uncertainty clearly marked.
Coming soon to the App Store and Google Play. Your first study will be free.
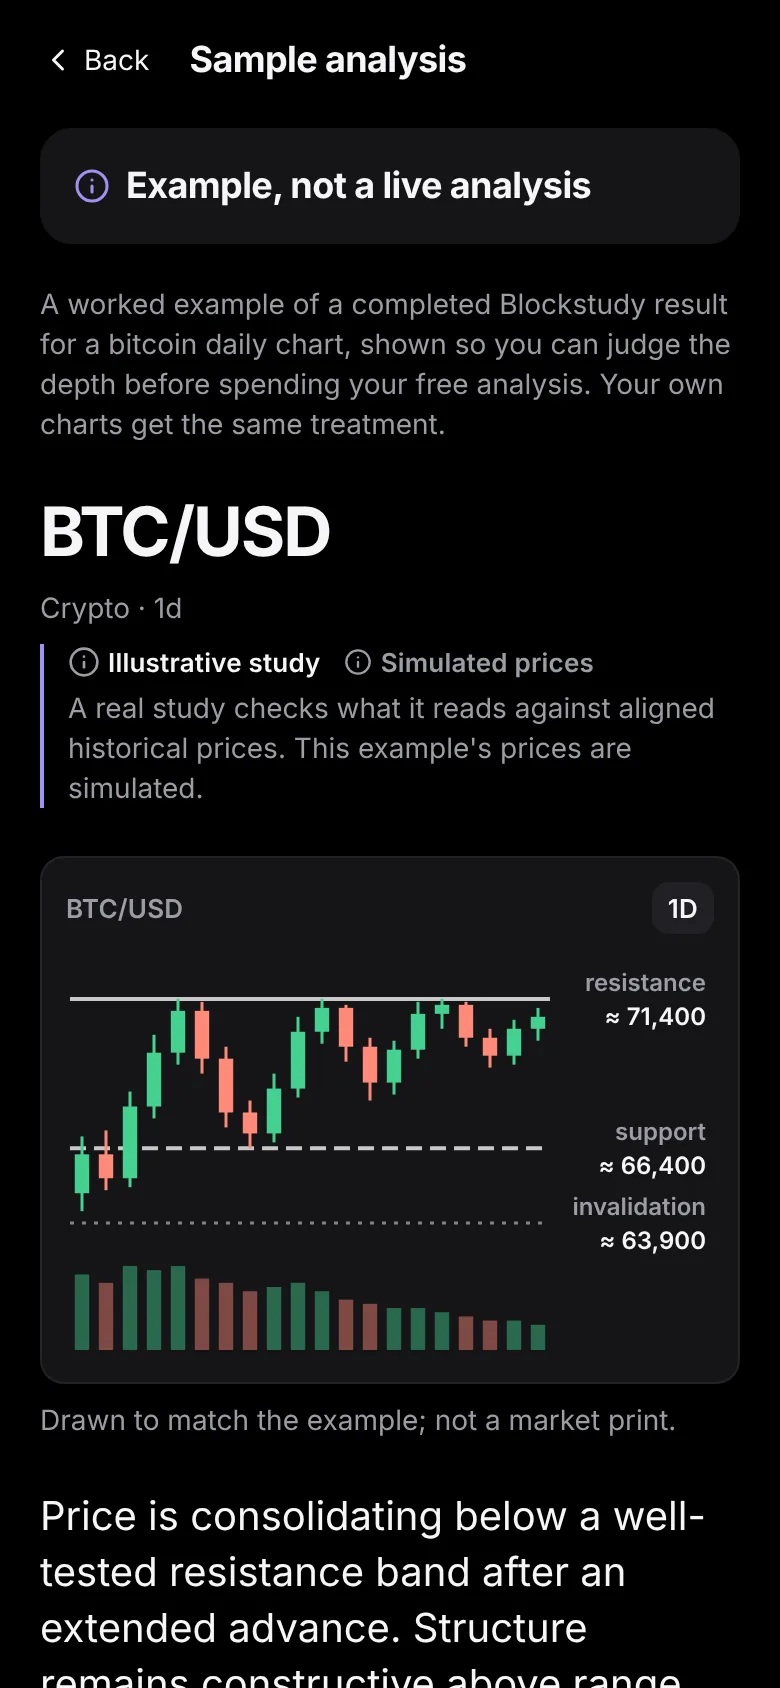
1 What it read
Levels from your chart. A real study checks them against 300 bars of real prices.
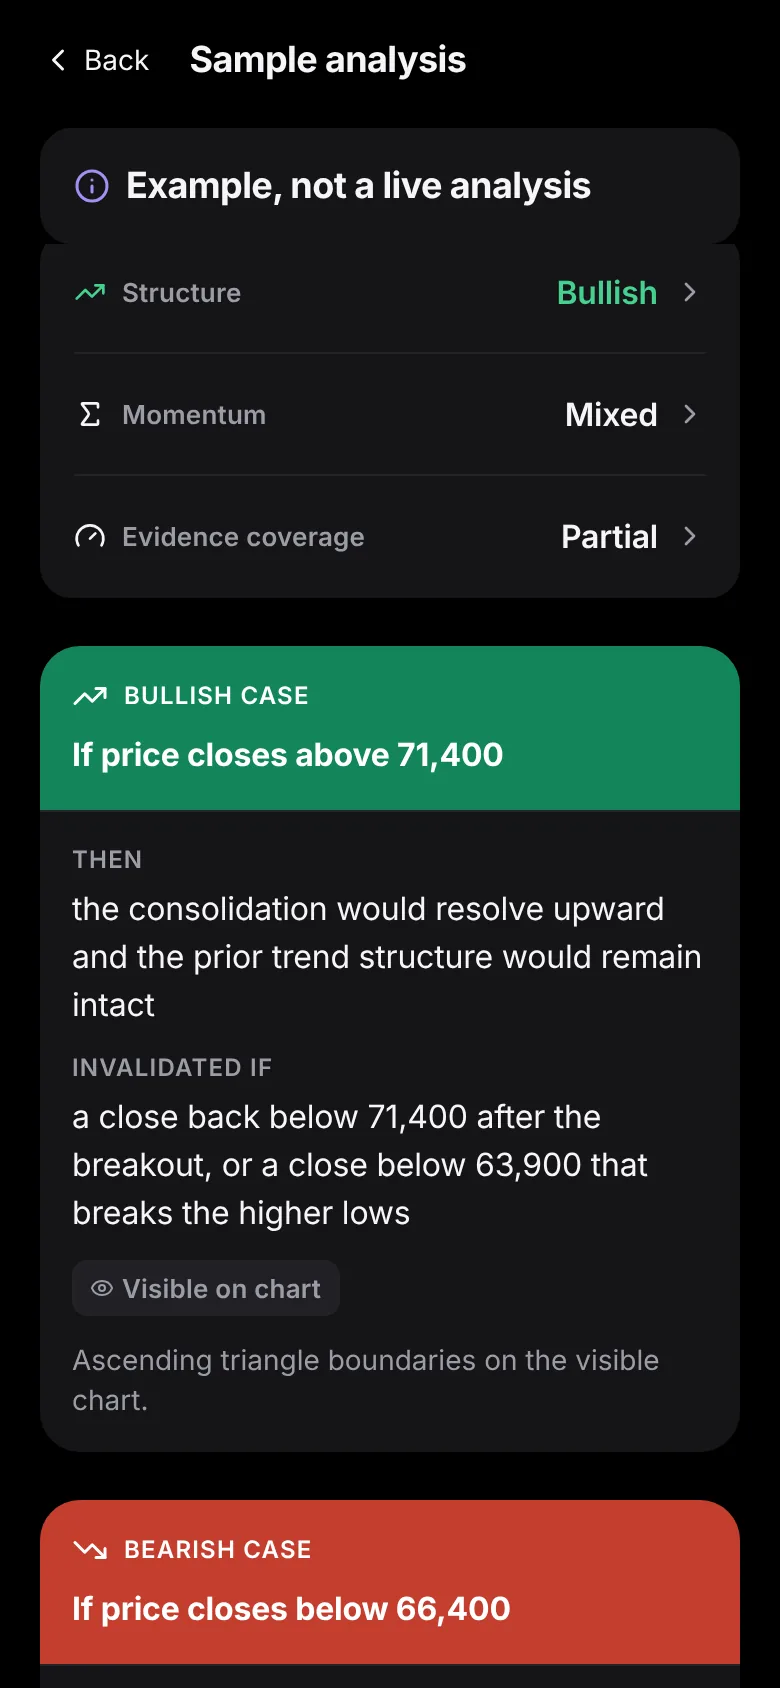
2 Both cases
What would strengthen each case, and the close that would invalidate it.
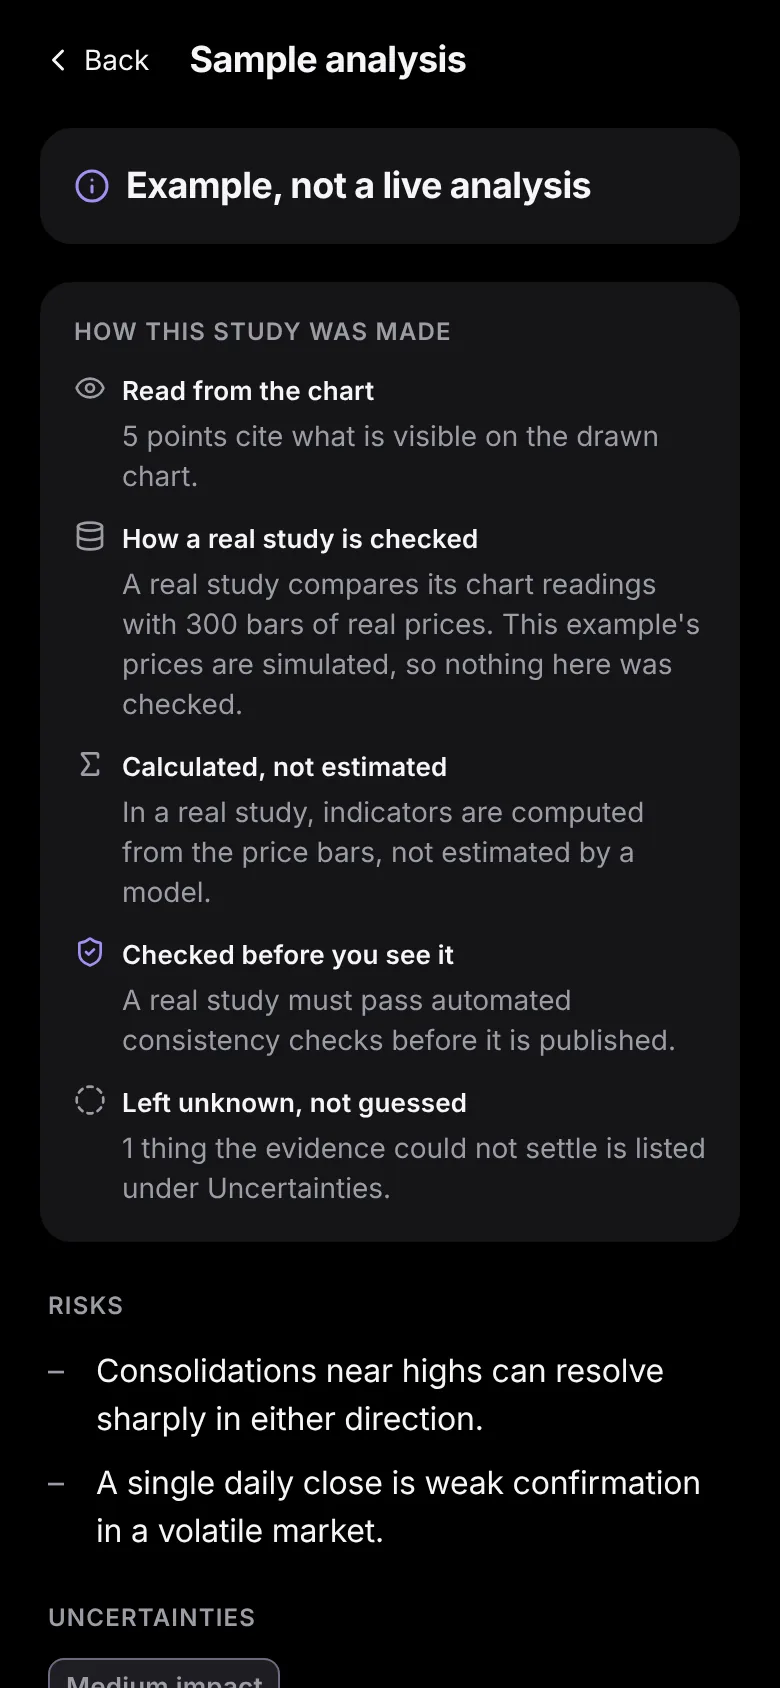
3 How it was made
Every point says where it came from. Gaps are listed, not guessed.
The app's own sample study. Example, not a live analysis.
Every point shows where it came from: your chart, real price data, or a calculation.
BTC/USD · 1D
Illustrative sample · not real or live market data · last 120 of 300 daily bars
RSI(14)
The same evidence, read both ways. Each case says what would strengthen it and the close that would invalidate it.
Levels come from this illustrative sample. Neither case is a prediction.
Step 1
Upload a screenshot from any charting app, or pick a stock or crypto symbol and timeframe.
Step 2
What it reads is compared with 300 bars of historical prices for the same symbol and timeframe. Indicators are calculated from those prices, not guessed from the image.
Step 3
Key levels, bullish and bearish scenarios, the source behind each point, and what is still uncertain.
Save your research, revisit the scenarios, and see which levels price actually crossed. Build a history of evidence you can learn from.
Every finished study is saved until you delete it, with favourites to keep the ones you come back to.
A study matched to real prices is followed for its next 20 bars. It records which of its two levels price closed beyond first, and when, or that price stayed between them.
Counts across your own followed studies, so you can look back at how your readings and the market compared.
A close beyond a level records a price event. It is not a grade of the study, a forecast, or a trade result. How outcomes are recorded
Some screenshots are incomplete, and some charts don't support a clear reading. Blockstudy labels those gaps instead of guessing.
Unreadable charts are rejected without using a study.
A point it can't confirm against historical prices stays labelled unverified.
When the evidence points both ways, the study explains the disagreement.
Your first study is free. Subscribe when you want more.
Blockstudy helps you study charts. It doesn't make trading decisions for you.
Supports selected cryptocurrency markets and US equities. Availability depends on supported symbols, intervals, and historical data coverage.
What happens to your screenshots, your studies and your account.
Read our Privacy PolicyDeleted 7 days after a completed study, and within 24 hours when a chart is rejected or a study fails.
Kept until you delete them in the app.
Any account can be deleted in the app, with or without an email address, and its studies and screenshots are deleted with it.
Send a screenshot or pick a symbol. Get key levels, bullish and bearish scenarios, and the sources behind them.
Coming soon to the App Store and Google Play. Your first study will be free.